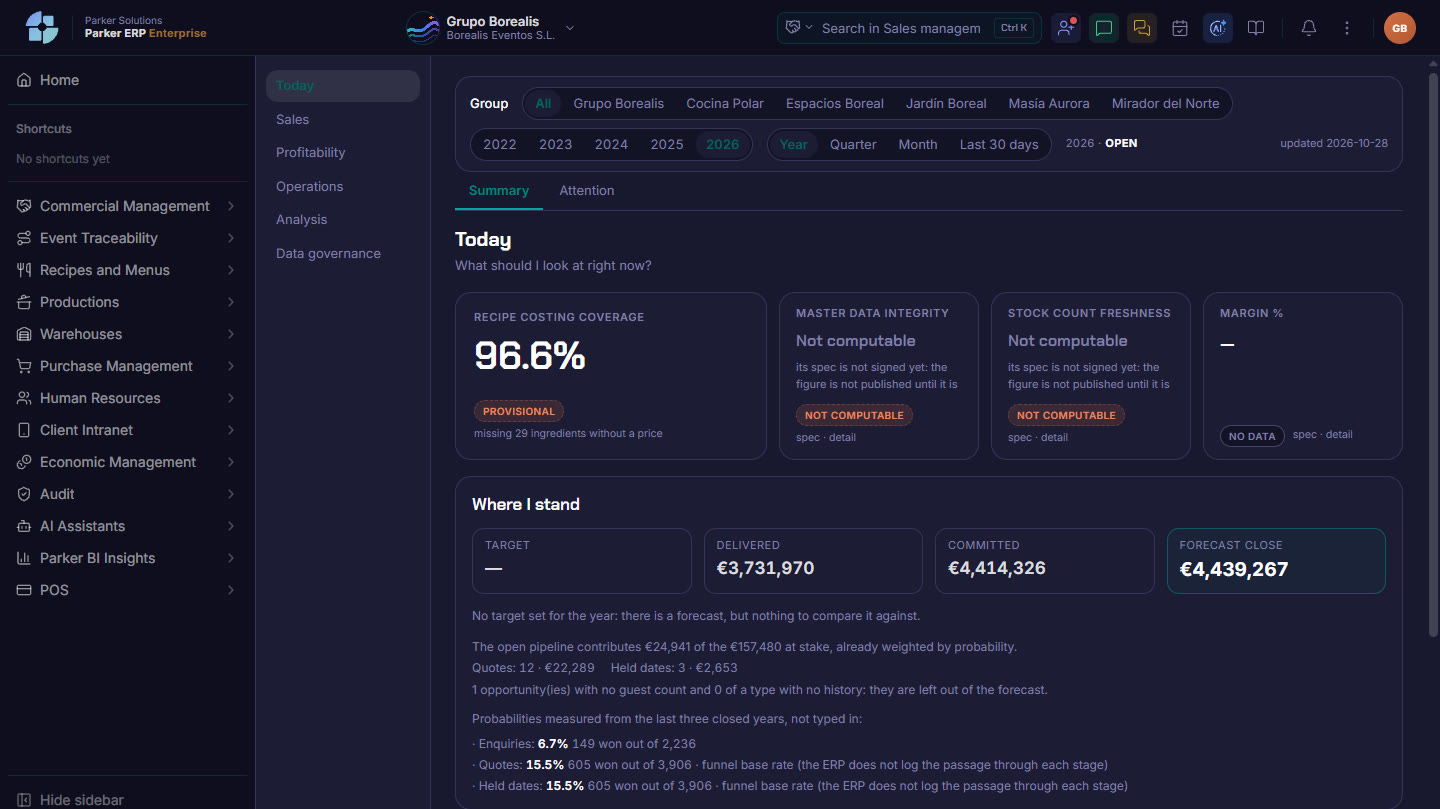
The dashboard for your events business, reading from all of Parker: what to look at today, how sales are going, where you make money and where it slips away, and how purchasing, the warehouse and staff are doing. Each person sees what is theirs, and every figure tells you how it is calculated.
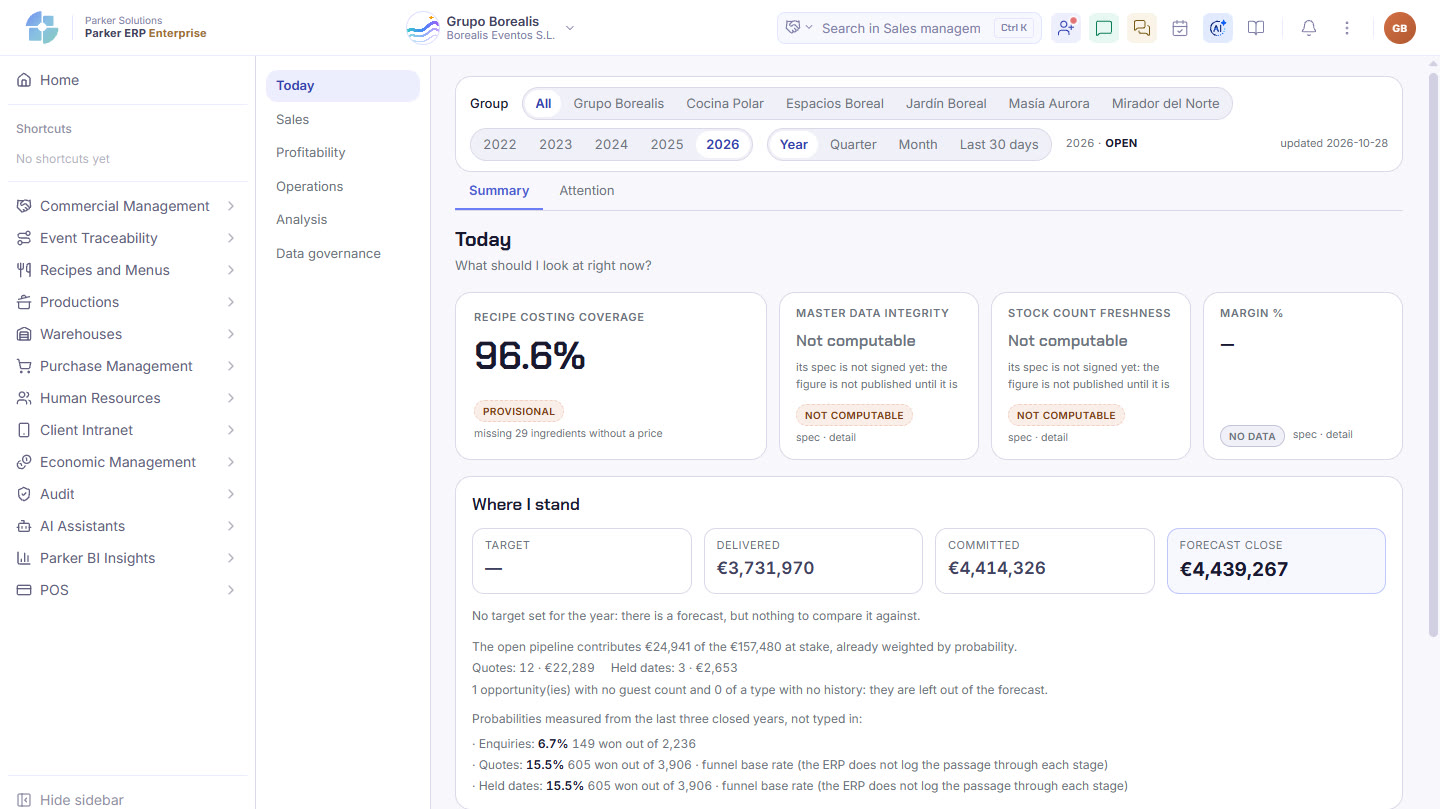
When you log in: the essentials of the period, what you are measured against, what needs a decision and what Parker has spotted on its own.
Sample figures, not from any client.
How much demand comes in, how much of it closes and who closes it?Enquiries, visits, quotes and contracts by channel and by sales rep, the average ticket and the reasons for cancellation. Who comes back and who your sales depend on. And whether you are above or below target, with the live pipeline.
Are we making money, and where is it slipping away?The margin of each event and by event type, what each dish really costs, which venue works hardest and which earns most, and the profit and loss account against the previous year.
What are we owed, and since when?The age of what you are owed, events held but not invoiced by age, and cash control per site.
How much do I buy, from whom, and who has raised their prices?Which suppliers you depend on, the average price per raw material and the price lists that have changed. Whether there is stock for what is committed. And labour cost, staff cost per event, coverage and working-time records.
What if I cross it with…?One metric crossed with one dimension, only with the combinations that make sense. And the queries someone built, saved so you can rerun them with today’s data.
“Seeing is not doing.”They explain a metric, point out profitability hotspots and data gaps, and sum up today’s issues. They suggest; they never change anything.
Each profile lands on its own Today screen with its four figures, sees only its areas and prints its department’s report in one click, or receives it by email. Choose a profile.
A dashboard is only useful if you know where every number comes from. Parker BI always tells you.
During go-live, your consultant sets the targets and benchmarks with you, so every figure has something to be compared against.
Sales, recipes, purchasing, warehouse, staff and finance feed the same dashboard, in real time.
With separate tools you pay several subscriptions and your data never connects. With Parker, everything is in one place.
Your consultant shows you the dashboard for your business, with your data.